


%22 fill-rule=%22nonzero%22%3E%3Cpath d=%22M15.754367 31.4866226c-4.2011645.0-8.13699236-1.636243-11.14414171-4.5991696-6.14696705-6.146967-6.14696705-16.0970936.0-22.24406062C7.57315186 1.68046581 11.5532025.0442227846 15.754367.0442227846S23.8913594 1.68046581 26.8985087 4.64339238L21.6359973 9.90590374c-2.2995848-2.2995848-5.7489619-3.09559492-9.0656708-1.85735695C8.28071641 9.99434931 6.37913667 14.5492961 8.05960249 18.9715746c1.45935189 3.2282632 4.46650121 5.129843 7.73898731 5.129843 2.2111392.0 4.2896101-.8844557 5.8816303-2.4322532l5.2625114 5.2625114c-3.0071494 2.9187038-6.9872 4.5549468-11.1883645 4.5549468z%22 id=%22%E8%B7%AF%E5%BE%84%22 fill=%22%23001f60%22/%3E%3Cg id=%22%E7%BC%96%E7%BB%84%22 transform=%22translate(31.099673, 0.663342)%22%3E%3Cpolygon id=%22%E8%B7%AF%E5%BE%84%22 fill=%22%23001f60%22 points=%220 14.5050733 0 30.2041619 7.42942781 30.2041619 7.42942781 7.11986831%22/%3E%3Crect id=%22%E7%9F%A9%E5%BD%A2%22 fill=%22%2300bbb4%22 x=%220%22 y=%22-125688713e-22%22 width=%227.42942781%22 height=%227.11986831%22/%3E%3C/g%3E%3Cpath d=%22M99.6449893 19.0600201C98.1414146 13.6648404 92.525121 12.6919392 87.9701742 11.895929 87.5279463 11.8074835 87.0414957 11.7190379 86.5992679 11.6305923 83.5921185 11.0556961 83.3267818 10.878805 82.884554 10.6134683 82.0885438 10.0827949 82.0885438 9.06567084 82.4423261 8.49077464 83.0614451 7.47365059 84.6976881 6.89875439 86.6434907 6.89875439c4.0242733.0 5.2625113 1.7246886 5.4394025 2.74181264H99.7334349c0-2.43225315-1.4151291-4.95295187-3.75893670000001-6.76608603C94.2498096 1.54779746 91.2426602.0 86.5992679.0 81.4252021.0 78.4622755 1.94580252 76.914478 3.58204555 75.2340122 5.35095693 74.3495565 7.65054173 74.4380021 9.90590374 74.7033388 16.1855391 80.3638552 18.0428961 85.2725843 18.9273518 85.759035 19.0157974 86.2454856 19.1042429 86.7319362 19.1926885 87.9259514 19.4138024 89.4737489 19.6349163 90.7562096 20.0329214 91.5964425 20.2982581 92.4366754 21.0500455 92.0828932 22.2440606c-.2653368.8402329-1.6804659 1.9458026-4.2011646 2.1669165C85.2283615 24.632091 83.1056679 23.9687492 82.1327666 22.8631796 81.4694249 22.1556151 81.3809793 21.2711594 81.3809793 20.8289315H73.9515515C73.9515515 23.5707442 75.1013439 26.0914429 77.135592 27.9930226c2.3880303 2.2111393 5.8816303 3.4051544 9.6847898 3.4051544C87.3510552 31.398177 87.8817286 31.3539543 88.412402 31.3097315 92.8346805 30.9117264 96.3725033 29.142815 98.3183058 26.3567796 99.9545488 24.2783087 100.396777 21.6691644 99.6449893 19.0600201z%22 id=%22%E8%B7%AF%E5%BE%84%22 fill=%22%23001f60%22/%3E%3Cpath d=%22M71.6519667 30.8675036 63.7360882 20.2098125C67.9372528 19.0157974 70.9886249 15.2126379 70.9886249 10.6134683 70.9886249 5.12984301 66.5221237.663341768 61.0384984.663341768H44.8529592V30.8675036H52.282387V20.5635948h3.2282633l7.606319 10.3039088h8.5349974zM52.2381643 7.82743287h8.3581062c1.59202029999999.0 2.874481 1.28246075 2.874481 2.87448103.0 1.5920202-1.2824607 2.874481-2.874481 2.874481H52.2381643V7.82743287z%22 id=%22%E5%BD%A2%E7%8A%B6%22 fill=%22%23001f60%22/%3E%3C/g%3E%3C/g%3E%3C/svg%3E)


%22%3E%3Cg id=%22%E7%BC%96%E7%BB%84-34%22 transform=%22translate(1654.000000, 46.000000)%22%3E%3Cg id=%22%E7%9F%A9%E5%BD%A2%22 opacity=%22.01%22%3E%3Cuse fill=%22%23fff%22 xlink:href=%22%23path-1%22/%3E%3Cuse fill=%22%23f2f3f7%22 xlink:href=%22%23path-1%22/%3E%3C/g%3E%3Cg id=%22sousuo%22 transform=%22translate(6.000000, 6.000000)%22%3E%3Cmask id=%22mask-3%22 fill=%22%23fff%22%3E%3Cuse xlink:href=%22%23path-2%22/%3E%3C/mask%3E%3Cg id=%22Clip-2%22/%3E%3Cpath d=%22M11.6489827.0271704545c6.433526.0 11.6491213 5.1088636355 11.6491213 11.4108750455.0 2.9073068-1.110104 5.5606704-2.9376763 7.5756477C20.393341 19.0389886 20.424763 19.0662955 20.4543121 19.0953068l3.24437 3.1817727C24.099711 22.6703523 24.1004046 23.3084659 23.7004509 23.7025227L23.6986821 23.7042614C23.2966127 24.0985568 22.6454913 24.0985568 22.243422 23.7042614l-3.2445434-3.1817728C18.9553873 20.4797386 18.915815 20.433375 18.8807514 20.3838409L18.8809942 20.3841136c-1.986763 1.5431591-4.4995838 2.4646705-7.2320115 2.4646705C5.21545665 22.8487841.0 17.7400568.0 11.4380455.0 5.13603409 5.21545665.0271704545 11.6489827.0271704545zm0 2.0661136355c-5.26855495.0-9.53975727 4.18384091-9.53975727 9.34476141.0 5.1609204 4.27120232 9.344625 9.53975727 9.344625 5.2686936.0 9.5397225-4.1837046 9.5397225-9.344625.0-5.1609205-4.2710289-9.34476141-9.5397225-9.34476141z%22 id=%22Fill-1%22 fill=%22%23424242%22 mask=%22url(%23mask-3)%22/%3E%3C/g%3E%3C/g%3E%3C/g%3E%3C/g%3E%3C/svg%3E)
%22%3E%3Cg id=%22%E7%BC%96%E7%BB%84-8%22 transform=%22translate(1165.000000, 90.000000)%22%3E%3Cg id=%22%E7%BC%96%E7%BB%84-5%22 transform=%22translate(30.000000, 35.000000)%22%3E%3Cg id=%22%E7%BC%96%E7%BB%84-6%22 transform=%22translate(413.000000, 3.000000)%22%3E%3Cg id=%22sousuo%22 transform=%22translate(12.000000, 12.000000)%22%3E%3Cmask id=%22mask-2%22 fill=%22%23fff%22%3E%3Cuse xlink:href=%22%23path-1%22/%3E%3C/mask%3E%3Cg id=%22Clip-2%22/%3E%3Cpath d=%22M14.6489827 3.02717045c6.433526.0 11.6491213 5.10886364 11.6491213 11.41087505.0 2.9073068-1.110104 5.5606704-2.9376763 7.5756477C23.393341 22.0389886 23.424763 22.0662955 23.4543121 22.0953068l3.24437 3.1817727C27.099711 25.6703523 27.1004046 26.3084659 26.7004509 26.7025227L26.6986821 26.7042614C26.2966127 27.0985568 25.6454913 27.0985568 25.243422 26.7042614l-3.2445434-3.1817728C21.9553873 23.4797386 21.915815 23.433375 21.8807514 23.3838409L21.8809942 23.3841136c-1.986763 1.5431591-4.4995838 2.4646705-7.2320115 2.4646705C8.21545665 25.8487841 3 20.7400568 3 14.4380455 3 8.13603409 8.21545665 3.02717045 14.6489827 3.02717045zm0 2.06611364c-5.26855495.0-9.53975727 4.18384091-9.53975727 9.34476141.0 5.1609204 4.27120232 9.344625 9.53975727 9.344625 5.2686936.0 9.5397225-4.1837046 9.5397225-9.344625.0-5.1609205-4.2710289-9.34476141-9.5397225-9.34476141z%22 id=%22Fill-1%22 stroke=%22%23f2fbff%22 fill=%22%23f5f5f5%22 mask=%22url(%23mask-2)%22/%3E%3C/g%3E%3C/g%3E%3C/g%3E%3C/g%3E%3C/g%3E%3C/g%3E%3C/svg%3E)
%22%3E%3Cg id=%22%E7%BC%96%E7%BB%84-19%22 transform=%22translate(515.000000, 180.000000)%22%3E%3Crect id=%22%E7%9F%A9%E5%BD%A2%22 fill=%22%23fff%22 opacity=%22.2%22 x=%220%22 y=%220%22 width=%2280%22 height=%2280%22 rx=%2240%22/%3E%3Cg id=%22sousuo%22 opacity=%22.7%22 transform=%22translate(21.000000, 21.000000)%22%3E%3Cmask id=%22mask-2%22 fill=%22%23fff%22%3E%3Cuse xlink:href=%22%23path-1%22/%3E%3C/mask%3E%3Cg id=%22Clip-2%22/%3E%3Cpath d=%22M18.4442225.0430198864c10.1864162.0 18.4444422 8.0890340936 18.4444422 18.0672187136.0 4.6032358-1.7576647 8.8043949-4.6513208 11.9947756C32.2894566 30.1450653 32.3392081 30.1883011 32.3859942 30.2342358l5.1369191 5.0378068C38.1578757 35.8947244 38.158974 36.905071 37.5257139 37.5289943L37.5229133 37.5317472C36.8863035 38.1560483 35.8553613 38.1560483 35.2187514 37.5317472l-5.1371936-5.0378069C30.0126965 32.4262528 29.9500405 32.3528437 29.8945231 32.2744148L29.8949075 32.2748466C26.7491994 34.7181818 22.7705665 36.1772415 18.4442225 36.1772415 8.25780636 36.1772415.0 28.0884233.0 18.1102386.0 8.13205398 8.25780636.0430198864 18.4442225.0430198864zm0 3.2713465936c-8.3418786.0-15.10461556 6.62441477-15.10461556 14.79587212.0 8.1714574 6.76273696 14.7956563 15.10461556 14.7956563 8.3420983.0 15.1045607-6.6241989 15.1045607-14.7956563.0-8.17145735-6.7624624-14.79587212-15.1045607-14.79587212z%22 id=%22Fill-1%22 fill=%22%23000%22 mask=%22url(%23mask-2)%22/%3E%3C/g%3E%3C/g%3E%3C/g%3E%3C/g%3E%3C/svg%3E)
%22%3E%3Cg id=%22%E7%BC%96%E7%BB%84-11%22 transform=%22translate(625.000000, 180.000000)%22%3E%3Cg id=%22%E7%9F%A9%E5%BD%A2%22 opacity=%22.1%22%3E%3Cuse fill=%22%23fff%22 xlink:href=%22%23path-1%22/%3E%3Cuse fill=%22%23000%22 xlink:href=%22%23path-1%22/%3E%3C/g%3E%3Cg id=%22%E5%BD%A2%E7%8A%B6%E7%BB%93%E5%90%88-2%22 opacity=%22.9%22 transform=%22translate(23.000000, 23.000000)%22 fill=%22%23fff%22%3E%3Cpath d=%22M3.41421356.585786438 16.849 14.02 30.2842712.585786438C31.024212-.154154326 32.1996962-.193098576 32.9854836.468953686L33.1126984.585786438C33.893747 1.36683502 33.893747 2.63316498 33.1126984 3.41421356L19.677 16.849 33.1126984 30.2842712C33.893747 31.0653198 33.893747 32.3316498 33.1126984 33.1126984s-2.0473786.781048599999998-2.8284272.0L16.849 19.677 3.41421356 33.1126984C2.6742728 33.8526391 1.49878864 33.8915834.713001205 33.2295311L.585786438 33.1126984c-.781048584-.781048599999998-.781048584-2.0473786.0-2.8284272L14.02 16.849.585786438 3.41421356c-.781048584-.78104858-.781048584-2.04737854.0-2.828427122.781048582-.781048584 2.047378542-.781048584 2.828427122.0z%22 id=%22%E5%BD%A2%E7%8A%B6%E7%BB%93%E5%90%88%22/%3E%3C/g%3E%3C/g%3E%3C/g%3E%3C/g%3E%3C/svg%3E)

%22 fill=%22%23fff%22 stroke=%22%23fff%22 stroke-width=%22.5%22%3E%3Cg id=%22%E7%BC%96%E7%BB%84-5%22 transform=%22translate(45.000000, 1550.000000)%22%3E%3Cg id=%22diqiu-(1)%22 transform=%22translate(5.002008, 10.003347)%22%3E%3Cpath d=%22M11.9962845.0c6.6265774.0 11.9982929 5.37184937 11.9982929 11.9982929.0 6.6265774-5.3717155 11.9983263-11.9982929 11.9983263-6.6264435.0-11.9982928682-5.3717489-11.9982928682-11.9983263C-.0020083682 5.37184937 5.369841.0 11.9962845.0zM5.77114644 3.6685523 5.72669456 3.70162343C3.21844351 5.60016736 1.59775732 8.6099749 1.59775732 11.9982929 1.59775732 12.2123515 1.60428452 12.4248368 1.61697071 12.6355816L1.61723849 12.6354477C3.80421757 11.9799833 5.42148954 12.1131046 6.48046862 13.1906276 7.01616736 13.7358661 7.31939749 14.337205 7.41991632 15.048L7.42530544 15.0886695C7.44920502 15.2762845 7.45770711 15.4316318 7.4620251 15.7256904L7.46440167 15.9032301C7.47353975 16.3908285 7.51929707 16.5114979 7.75414226 16.8110795 7.93077824 17.0341423 8.13174895 17.228954 8.38711297 17.4240335 8.51106276 17.5184268 8.638159 17.6082678 8.76853556 17.6936569L8.82343096 17.7293389 9.27899582 18.0308619 9.30734728 18.0500753C10.342795 18.7493556 10.8550628 19.4148954 11.0353808 20.4309623 11.1534728 21.098477 11.1357992 21.7420251 10.9824268 22.3480837 11.3193975 22.3806192 11.6577741 22.396854 11.9962845 22.396854c5.7429624.0 10.3985272-4.6555988 10.3985272-10.3985611C22.3948117 10.5751967 22.1089874 9.21874477 21.5914644 7.98353138 21.6105774 8.15417573 21.6199833 8.32582427 21.6197155 8.49750628c0 1.45529707-1.1666946 3.77549792-2.8755147 6.02865272C18.6813054 14.6093054 18.6225941 14.6992803 18.564954 14.801272L18.545205 14.8366862 18.5172218 14.8903096C18.4484351 15.0243347 18.3877824 15.16241 18.3353305 15.3037322L18.3107615 15.3716151C18.2834142 15.4470628 18.2570042 15.5227448 18.2315314 15.5988619L18.2066611 15.6740418 18.0977406 16.011113C17.6023431 17.5066778 16.8482678 18.2018745 15.4544603 18.2018745c-.8604854.0-1.4555649-.398125499999999-1.7929038-1.2191465L13.6472971 16.9475816c-.218477-.5481172-.3466109-1.2688536-.5146444-2.7258243L13.105205 13.980251 13.0008703 13.0474644C12.9553808 12.6472301 12.9245188 12.390159 12.8920837 12.1486862L12.86959 11.9809205C12.6048201 10.0421088 12.0975063 7.91096234 11.7792469 7.28411715L11.7695732 7.26530544C11.6725356 7.08066946 11.3546778 6.95320502 10.1593305 6.78269456L10.1228452 6.77760669 10.0539582 6.76830126 9.92046862 6.74935565c-1.3836318-.19979916-1.9576569-.36964017-2.60736402-.81158159C6.50035146 5.38440167 5.98192469 4.6099749 5.77114644 3.6685523zM1.88448536 14.2269791 1.84030126 14.2411046c.84060251 3.8238996 3.78570711 6.8589121 7.55936401 7.8289875C9.52609205 21.6528536 9.54687866 21.200569 9.46021757 20.7099916 9.36646025 20.1814895 9.12508787 19.8620586 8.44033473 19.3950126L8.36619247 19.3450711l-.41579916-.2747113L7.93104603 19.057272 7.8894728 19.0301925C7.74460251 18.9352971 7.60284519 18.8357824 7.46426778 18.7318159L7.41770711 18.6966695C7.05787448 18.4216904 6.76133891 18.1344268 6.49760669 17.8011381 6.01369038 17.1842343 5.87494561 16.7318159 5.86356485 15.8464937L5.86189121 15.7073808C5.85807531 15.4845858 5.8518159 15.3888536 5.83534728 15.2676485 5.78393305 14.9048033 5.63856067 14.6163682 5.33938075 14.3119665 4.76579079 13.7281674 3.65161506 13.6633305 1.88448536 14.2269791zM11.9962845 1.59976569c-1.7042343.0-3.31263596.41004184-4.73221755 1.13676987C7.28328033 3.57245188 7.58754812 4.177841 8.18681172 4.59702092L8.21308787 4.61506276C8.61723849 4.89004184 9.0049205 5.00287866 10.1939749 5.17245188L10.2717992 5.18346444 10.3410879 5.1927364 10.4310628 5.20555649c.768535500000001.11126359 1.2664435.22031799 1.6584435.37576569C12.6001004 5.78373222 12.9554812 6.08291213 13.1851046 6.52c.431999999999999.81877824.989523 3.15755649 1.2774561 5.3032301L14.4914477 12.0402678C14.508318 12.169205 14.5251883 12.3062427 14.5442678 12.4675816L14.5904268 12.8680837 14.7099582 13.9339582c.1594979 1.3988284.276150599999999 2.063297.4311966 2.4406694L15.1582929 16.4159331C15.2323013 16.5917992 15.2551967 16.6017406 15.4406025 16.6021088H15.4544603c.5962175.0.813288699999999-.1828954 1.095297-1.0066611L16.5773724 15.5136067 16.6850879 15.1801841C16.7140084 15.0912803 16.7440669 15.0027448 16.7751967 14.9146109L16.8273473 14.7691046C16.9062092 14.5536067 16.9987615 14.343364 17.1043013 14.1397824L17.140251 14.0717992C17.241205 13.8872971 17.3485523 13.7193975 17.468954 13.5601339c1.5115314-1.9929372 2.5509958-4.06011716 2.5509958-5.06262762C20.0199498 8.06172385 19.9319498 7.6667113 19.6852218 7.00103766L19.5777406 6.71169874C19.4670126 6.41030962 19.4051548 6.22948954 19.3644854 6.088 19.2829121 5.8030795 19.263431 5.59022594 19.3395146 5.34674477 19.391431 5.17874477 19.4713305 5.02065272 19.5755314 4.87906276c-1.8967029-2.0185774-4.5907615-3.27929707-7.5792469-3.27929707z%22 id=%22Fill-1%22/%3E%3C/g%3E%3C/g%3E%3C/g%3E%3C/g%3E%3C/svg%3E)
With the development of trade globalization and the continuous quality improvement of people’s life in China, imported food has become an important food source for Chinese consumers, and people’s safety requirements for imported food are also increasing. The General Administration of Quality Supervision, Inspection and Quarantine of the People’s Republic of China (AQSIQ) attaches great importance to the imported food safety, and supervises the imported food strictly. On 30 July 2015, AQSIQ published the report of the quality and safety of imported food in China in the first half year of 2015.
1. The trade of imported food in China in the first half year of 2015
1.1 Rapid increase in imports
In the first half year of 2015, there were total 552,000 batches of imported food (20.35 million tons, 22.23 billion dollars) inspected and quarantined by local CIQs. Compared with the same time in 2014, the increase rates for the quantity, weight and sum of money were 11.9%, 21.2% and -10.8%, respectively. From 2005 to 2014, the trade value of imported food has increased by 4.3 times, and the average annual growth rate reached 17.6%, as showed in figure 1.
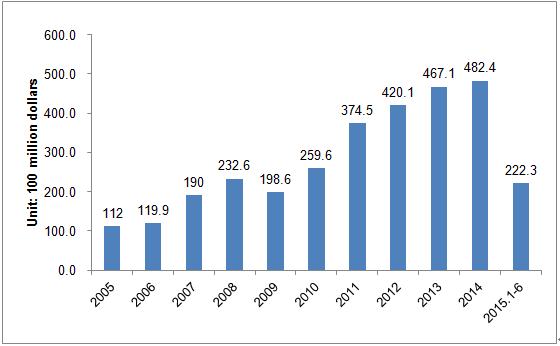
Figure 1. The trade value of imported food in China from 2005 to the first half year of 2015
1.2 Wide range of imported sources
In recent years, the sources of imported food in China have turned more international. In the first half year of 2015, China imported foods from 179 countries or regions. Among them, the top 10 in imported trade value were: the European Union, ASEAN, America, New Zealand, Brazil, Australia, Russia, Canada, Ukraine and South Korea, with a total amount of 17.70 billion dollars, accounting for 79.9% of total trade value (figure 2).

Figure 2. Sources of imported food in China in the first half year of 2015
1.3 Imported food categories were very complete
In recent years, the imported food categories in China have almost covered all kinds of global excellent foods. In the first half year of 2015, the top 10 food categories in imported trade value were: grease and oil, dairy products, aquatic products, meat, cereals and products, wine, sugar, beverage and other processed foods and dried nuts, with a total value of 20.87 billion dollars, accounting for 93.9% of total trade value (figure 3). Among them, the imported volume of vegetable oil, milk powder, meat and aquatic products reached 3.396 million tons, 987 thousand tons, 1.325 million tons and 2.006 million tons, respectively.

Figure 3. Imported categories in the first half year of 2015
1.4 Import ports were relatively concentrated
The import ports have become more and more in recent years, and mainly in coastal areas. In the first half year of 2015, there were 287 ports used to import food. The top 10 imported ports in imported trade value were: Shanghai, Tianjin, Qingdao, Shenzhen, Dalian, Guangzhou, Xiamen, Yantai, Nantong, and Beijing, with a total value of 16.03 billion dollars, accounting for 72.1% of the total trade value (figure 4)
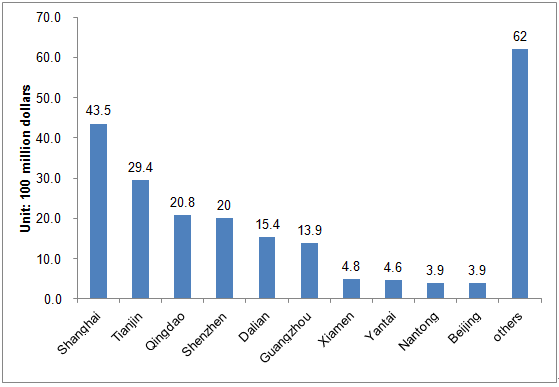 Figure 4. Import ports in the first
half year of 2015
Figure 4. Import ports in the first
half year of 2015
2. Quality and safety report of imported food in China in the first half year of 2015
2.1 Imported food safety situation is stable
Over these years, the overall situation of the quality and safety of imported food in China has remained stable, without serious imported food quality and safety problems occurred. In the first half year of 2015, AQSIQ further strengthened the inspection and quarantine of imported food. There were 1255 batches of unqualified imported food from 57 countries and regions inspected by local CIQs, and the total weight of these unqualified foods was 4960 tons, the value was 14.52 million dollars. Compare with the same time in last year, the unqualified batches were decreased by 12.3% (Figure 5), indicating that the quality of imported food raises steadily.
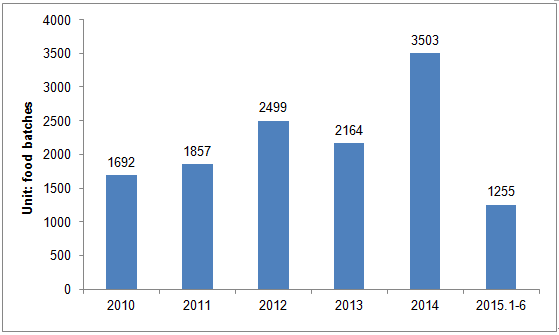
Figure 5. The amount of unqualified imported food from 2010 to the first half year of 2015
2.2 The main categories of unqualified imported food
In the first half year of 2015, almost all types of imported food were detected in non-compliance with national standards of food safety and regulatory requirements in China. And the top 10 food categories in food batches were: drinks, cakes and biscuits, cereal and products, sugar, other processed food, aquatic products, wine, dairy products, condiments, and dried nuts, accounting for 90.1% of the total unqualified imported food batches(Figure 6).
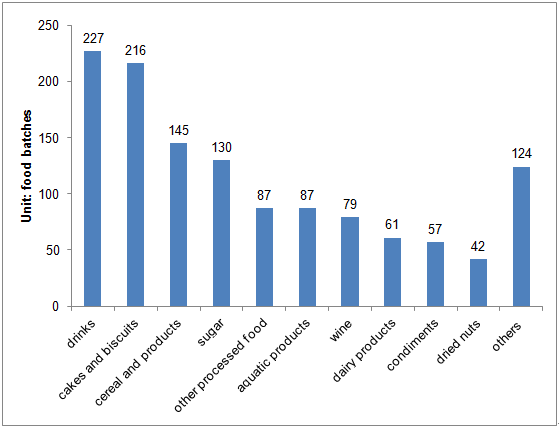
Figure 6. Unqualified categories imported food in China in the first half year of 2015
2.3 The main source of unqualified imported food
In the first half year of 2015, the local CIQ rejected or destroyed the unqualified imported food from 57 countries or regions. The top 10 sources of the non-compliant imported food were: the European Union, Taiwan, ASEAN, America, Japan, South Korea, Canada, Norway, New Zealand and Australia, respectively, which covered 91.5% of the total unqualified imported food batches (Figure 7).
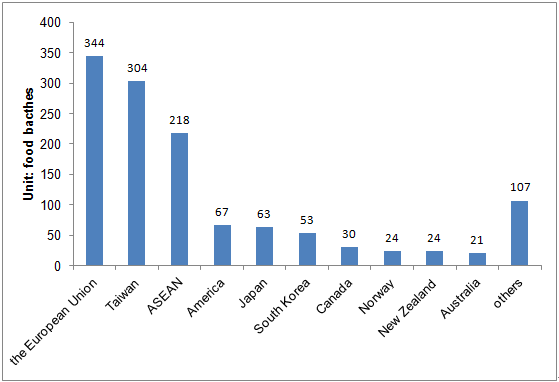
Figure 7. The sources of unqualified imported food in the first half year of 2015
2.4 Main reasons for unqualified imported food.
There were 19 kinds of non-compliant reasons for the unqualified imported food in the first half year of 2015. And the top 10 reasons were: in-compliant food additive, unqualified microorganism, unqualified character, non-compliant label, substandard certificate, exceeded pollutants, certificate does not match the goods, unqualified package, non-edible additives, and genetically modified ingredients, which covered 97.4% of the total unqualified imported food batches (Figure 8). Among the safety and health problems, exceeded food additives, microbial contamination, and exceed pollutants were more outstanding, which accounted for 48.0% of the total unqualified imported food. Among the non safety or health issues, the 3 main problems were: unqualified character, non-compliant label, and substandard certificate, which accounted for 43.6% of the total unqualified imported food.
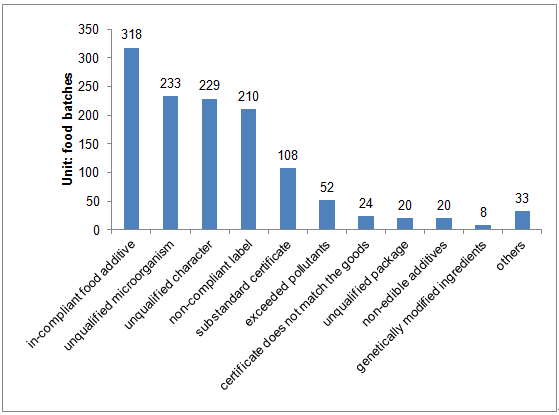
Figure 8. Non-compliant reasons for the unqualified imported food in the first half year of 2015
Different categories of imported food have different non-compliant reasons. The main rejected reasons for beverages, cakes and biscuits and sugar were food additives (like acid red, benzoic acid, sodium aluminosilicate, etc.) exceeded or out of the scope. And for wine and cereal grain products, the main unqualified reason was heavy metals (like Cu, Fe, etc. ) exceed the standard. And for imported aquatic products, food-borne pathogen contamination (like Listeria monocytogenes, Salmonella, and etc.) was the main unqualified reason.


%22 fill=%22%23fff%22%3E%3Cpath d=%22M.657101983 2.307153C.717756374 2.307153.778028329 2.31550378.836286119 2.33192527L7.50153824 4.21642598C7.78436261 4.29639486 7.97948159 4.5538687 7.97948159 4.84716431V17.3291587c0 .362011299999999-.29419547.6554851-.65712748.6554851C7.26210765 17.9846438 7.20214164 17.9763949 7.14408782 17.9600752L.478835694 16.086013C.195603399 16.0064514.0 15.7486721.0 15.4550964V2.96263815C0 2.60062683.294195467 2.307153.657101983 2.307153zM5.24993201 1.14496912 5.26418414 1.14822796 10.5314278 2.42411481 10.5457819 2.42839204C11.0528159 2.57776403 11.3979008 3.04596771 11.4058555 3.57507096L11.4060595 3.59375837V15.5010512C11.4060595 15.9784967 11.1305779 16.4143157 10.6985524 16.6097188L10.680119 16.6178913 9.23453541 17.2427485C8.92539943 17.3764118 8.56606232 17.2346777 8.43203116 16.9262845 8.30006516 16.6223468 8.43590652 16.2700101 8.73558357 16.1318659L8.74932578 16.1257046 10.1852465 15.504921 10.1853484 15.50431 10.1856544 15.5010512 10.1855524 3.5931728 4.97626062 2.33131424C4.65348442 2.253153 4.45359773 1.93231 4.5239915 1.61039769L4.52728045 1.59616573C4.60567989 1.27415158 4.92725779 1.0747513 5.24993201 1.14496912zM1.2204051 3.70593376V15.0296396l5.53864589 1.5573182V5.2719083L1.2204051 3.70593376zM8.58141076.0158828415 8.59556091.0192689802 13.7740793 1.34834112 13.7845326 1.3513199C14.2915666 1.50079373 14.6366516 1.96902287 14.6446317 2.49810066L14.6447082 2.51678807V14.4240809c0 .477471-.2753541.9132645-.707507100000001 1.108693L13.9188952 15.540921 12.4732861 16.1657782C12.1640737 16.2994415 11.8047365 16.1577075 11.6707819 15.8493142 11.5388159 15.5454019 11.6746572 15.1930398 11.9743343 15.0548956L11.9880765 15.0487343 13.4240227 14.4279507 13.4240992 14.4273652 13.4243031 14.4240809V2.51559147L8.29149858 1.19835809C7.96992068 1.11581778 7.77441926.792301512 7.84909632.471356675L7.85258924.457150168C7.93534844.13630717 8.2596289-.0587140467 8.58141076.0158828415z%22 id=%22ziliao%22/%3E%3C/g%3E%3C/g%3E%3C/svg%3E)
%22/%3E%3C/g%3E%3C/g%3E%3C/svg%3E)
%22%3E%3Cg id=%22%E7%BC%96%E7%BB%84-13%22 transform=%22translate(30.000000, 2950.000000)%22%3E%3Cg id=%22%E7%BC%96%E7%BB%84-3%22 transform=%22translate(15.000000, 950.000000)%22%3E%3Cg id=%22%E7%BC%96%E7%BB%84-27%22 transform=%22translate(40.000000, 215.000000)%22%3E%3Cg id=%22%E7%BC%96%E7%BB%84-10%22 transform=%22translate(0.000000, 144.000000)%22%3E%3Crect id=%22%E7%9F%A9%E5%BD%A2%22 fill=%22%23d8d8d8%22 opacity=%22.01%22 x=%220%22 y=%220%22 width=%2232%22 height=%2232%22/%3E%3Cg id=%22ios-call%22 opacity=%22.4%22 transform=%22translate(4.800000, 4.800000)%22%3E%3Cmask id=%22mask-2%22 fill=%22%23fff%22%3E%3Cuse xlink:href=%22%23path-1%22/%3E%3C/mask%3E%3Cg id=%22Clip-2%22/%3E%3Cpath d=%22M21.739546 17.5430608C20.882919 16.6863974 18.8257249 15.3985249 17.8117151 14.9147941 16.6345314 14.3495128 16.2032859 14.3611681 15.3699694 14.9614517c-.693453.5012501-1.1421814.9673158-1.9406413.7926322C12.631014 15.5850459 11.057587 14.3903428 9.53067187 12.8692553c-1.52676943-1.5267694-2.71564488-3.10019644-2.8846465-3.89865628-.16903805-.80414178.29720975-1.2470426.7924865-1.9406413C8.03875902 6.1966413 8.05627837 5.76539577 7.48516943 4.58821203 7.0014387 3.56837463 5.7193574 1.51704455 4.85690276.660381138 4.00023935-.196245854 3.80789073-.00972487805 3.33596098.159276748c0 0-.69942635.279726829-1.39287935.740001301C1.08641821 1.47049626.608515122 1.94829008.270621138 2.66505366c-.3322120323.7168-.7168 2.0513665 1.241214962 5.53626016C3.09109073 11.0161015 4.64135285 13.1489821 6.94323512 15.4451824L6.95489041 15.4568377c2.30188227 2.3019187 4.42893529 3.8519987 7.24372289 5.4312898 3.4849301 1.9581242 4.8194602 1.573427 5.5362602 1.2413606C20.4516735 21.7972397 20.9295766 21.3193366 21.5006855 20.456882 21.9610693 19.7634289 22.2407961 19.0641119 22.2407961 19.0641119 22.4098341 18.5920364 22.6020371 18.3996878 21.739546 17.5430608z%22 id=%22Fill-1%22 fill=%22%23000%22 mask=%22url(%23mask-2)%22/%3E%3C/g%3E%3C/g%3E%3C/g%3E%3C/g%3E%3C/g%3E%3C/g%3E%3C/g%3E%3C/svg%3E)
%22%3E%3Cg id=%22%E7%BC%96%E7%BB%84-13%22 transform=%22translate(30.000000, 2950.000000)%22%3E%3Cg id=%22%E7%BC%96%E7%BB%84-3%22 transform=%22translate(15.000000, 950.000000)%22%3E%3Cg id=%22%E7%BC%96%E7%BB%84-27%22 transform=%22translate(40.000000, 215.000000)%22%3E%3Cg id=%22%E7%BC%96%E7%BB%84-10%22 transform=%22translate(0.000000, 206.000000)%22%3E%3Crect id=%22%E7%9F%A9%E5%BD%A2%22 fill=%22%23d8d8d8%22 opacity=%22.01%22 x=%220%22 y=%220%22 width=%2232%22 height=%2232%22/%3E%3Cg id=%22ios-mail%22 opacity=%22.4%22 transform=%22translate(4.800000, 8.000000)%22 fill=%22%23000%22%3E%3Cpath d=%22M22.2035796 1.96720174 16.4132132 8.05344902C16.3701285 8.09790889 16.3701285 8.16447722 16.4132132 8.20893709l4.0521802 4.45365731c.274484099999999.2832104.274484099999999.738603.0 1.0216746C20.3308589 13.8230976 20.1478583 13.8953579 19.9703736 13.8953579 19.7927207 13.8953579 19.6097201 13.8230976 19.4751856 13.684269L15.4391495 9.24730586C15.3961994 9.20298482 15.3261742 9.20298482 15.2830559 9.24730586L14.298364 10.2802603c-.8233514.8607722-1.9158054 1.3382733-3.0889129 1.3438265C10.0201994 11.6296399 8.89004204 11.1132321 8.05592793 10.2413536L7.10877117 9.24730586C7.06568649 9.20298482 6.9957958 9.20298482 6.95271111 9.24730586L2.91667508 13.684269c-.13453454.1388286-.31743424.2110889-.49505346.2110889-.17761922.0-.36051892-.0722602999999999-.49505345-.2110889C1.65211772 13.4011974 1.65211772 12.9458048 1.92656817 12.6625944L5.97878198 8.20893709c.03756877-.044459869999999.03756877-.1110282.0-.155488069999999L.183000601 1.96720174C.112975375 1.89494143.0 1.94498915.0 2.04491106V14.2230629C0 15.2004165.774885285 16.0000347 1.72200841 16.0000347H20.6644372C21.611594 16.0000347 22.3866138 15.2004165 22.3866138 14.2230629V2.04491106C22.3866138 1.94498915 22.2680889 1.90052928 22.2035796 1.96720174z%22 id=%22Fill-1%22/%3E%3Cpath d=%22M11.1933069 10.1747852C11.9897177 10.1747852 12.7376961 9.85266811 13.2973598 9.264L21.7407135.395626898C21.4448721.15132321 21.0788372.00694143167 20.6752336.00694143167H1.71662703c-.40360361.0-.774885288.14438177833-1.065513516.38868546633L9.09446727 9.264C9.64878318 9.84711497 10.3968625 10.1747852 11.1933069 10.1747852z%22 id=%22Fill-2%22/%3E%3C/g%3E%3C/g%3E%3C/g%3E%3C/g%3E%3C/g%3E%3C/g%3E%3C/g%3E%3C/svg%3E)


%22/%3E%3C/g%3E%3C/g%3E%3C/svg%3E)
%22%3E%3Cg id=%22%E7%BC%96%E7%BB%84-11%22 transform=%22translate(1280.000000, 250.000000)%22%3E%3Crect id=%22%E7%9F%A9%E5%BD%A2%22 stroke=%22%23000%22 fill=%22%23fff%22 x=%22.5%22 y=%22.5%22 width=%2239%22 height=%2239%22 rx=%2219.5%22/%3E%3Cg id=%22%E5%BD%A2%E7%8A%B6%E7%BB%93%E5%90%88-2%22 transform=%22translate(11.500000, 11.500000)%22 fill=%22%23000%22%3E%3Cpath d=%22M1.70710678.292893219 8.424 7.01 15.1421356.292893219C15.5026196-.0675907428 16.0698506-.0953202783 16.4621418.209704612L16.5563492.292893219C16.9468735.683417511 16.9468735 1.31658249 16.5563492 1.70710678L9.839 8.424l6.7173492 6.7181356C16.9468735 15.5326599 16.9468735 16.1658249 16.5563492 16.5563492s-1.0236893.390524299999999-1.4142136.0L8.424 9.839 1.70710678 16.5563492C1.34662282 16.9168331.779391764 16.9445627.387100557 16.6395378L.292893219 16.5563492c-.3905242919-.390524299999999-.3905242919-1.0236893.0-1.4142136L7.01 8.424.292893219 1.70710678c-.3905242919-.39052429-.3905242919-1.023689269.0-1.414213561.390524292-.3905242919 1.023689271-.3905242919 1.414213561.0z%22 id=%22%E5%BD%A2%E7%8A%B6%E7%BB%93%E5%90%88%22/%3E%3C/g%3E%3C/g%3E%3C/g%3E%3C/g%3E%3C/svg%3E)